On your organizational dashboard, you’ll see a series of stats for your Scrumban projects like the one below.
Example Stats:
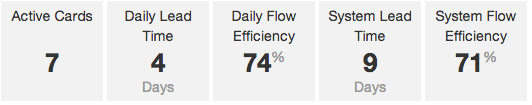
The number of cards currently on the kanban board for this project.
Lead time is only calculated for completed cards. It is the sum of the time it spent in cells that have been marked with the Include in Lead Time calculations option. It will be measured in either hours or days depending on the value.
The Daily Lead Time tells you the average lead time of cards completed over the previous day’s time. You may see a value of n/a if no cards were completed in the calculation period.
The System Lead Time tells you the average lead time of all cards completed in a project.
Flow efficiency is also only calculated for completed cards. It takes the “work time” of a card and divides it by the lead time of that card. “Work time” is one of 4 types of time (wait, setup, work, done) a cell can be assigned when creating your board.
The Daily Flow Efficiency represents the average of cards completed over the previous day’s time.
The System Flow Efficiency represents the average of all cards completed.
These stats are calculated once a day.
|
Tutorial Videos Tech Support Contact Us Blog Self Install / Private Server Account Settings Logout About Us Changelog Developer API Terms of Service Privacy Policy |

|


 ScrumDo is a registered trademark of ScrumDo, LLC. Copyright ScrumDo LLC © 2012 |