When viewing your iteration, you can select between three different types of charts. Let’s look at three examples from the same iteration.
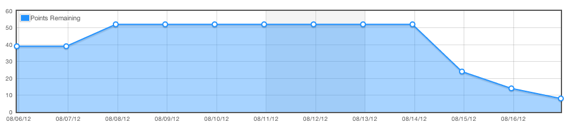
The first chart is a burndown chart. The main benefit to a burndown is that it’s the simplest chart you can use to see progress through a sprint. It answers the single question of “How much work is left.” Looking at this chart, I’d tell a story something like this
We started our iteration, and after a couple days added a couple stories. Then, towards the end of the iteration a lot of work came together to finish off most of the work.
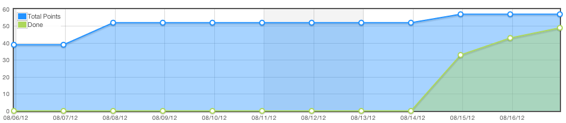
While slightly harder to read than burndown charts, burnup charts give the additional benefit of seeing how the total amount of work has changed over an iteration. This chart tells this story:
We started our iteration, and after a couple days added a couple stories. Then, towards the end of the iteration we finished a lot of work and decided to add a little bit more. We nearely completed all of the work by the end.
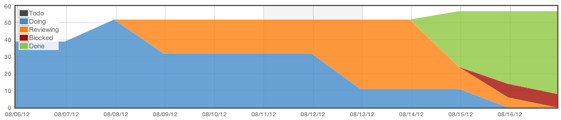
The stacked charts are the hardest to read, but give the most complete picture of what went on in an iteration. It lets you see how stories moved through their various statuses on their way to being complete. On this particular team, an engineer will mark a story as “Reviewing” when it’s implemented, and a QA engineer will mark it done. The story it tells is:
We started our iteration, and after a couple days added a couple stories. The engineers made steady progress and ran out of work in the last few days, so we pulled some more stories in. The QA team had a slow start, but made great progress through the end of the iteration. One story got blocked, and we were unable to resolve that by the end of the sprint.
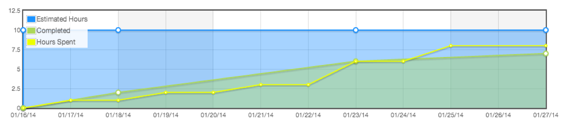
Visually, the time based chart is very similar to the burn up charts. The biggest difference is that instead of points, the chart is entirely measured in hours. It is driven off of the time estimates on your stories and time tracked by individual people.
In this example, the blue line represents the total estimate of all stories and tasks in this iteration. The yellow line represents the actual amount of time spent. The green section represents the estimate of stories that have been completed.
When the yellow line is below your completed line, you are spending less time on your stories than estimated. When it’s above, you’re spending more time than estimated.
|
Tutorial Videos Tech Support Contact Us Blog Self Install / Private Server Account Settings Logout About Us Changelog Developer API Terms of Service Privacy Policy |

|


 ScrumDo is a registered trademark of ScrumDo, LLC. Copyright ScrumDo LLC © 2012 |